Detection Theory Curves
What you're seeing
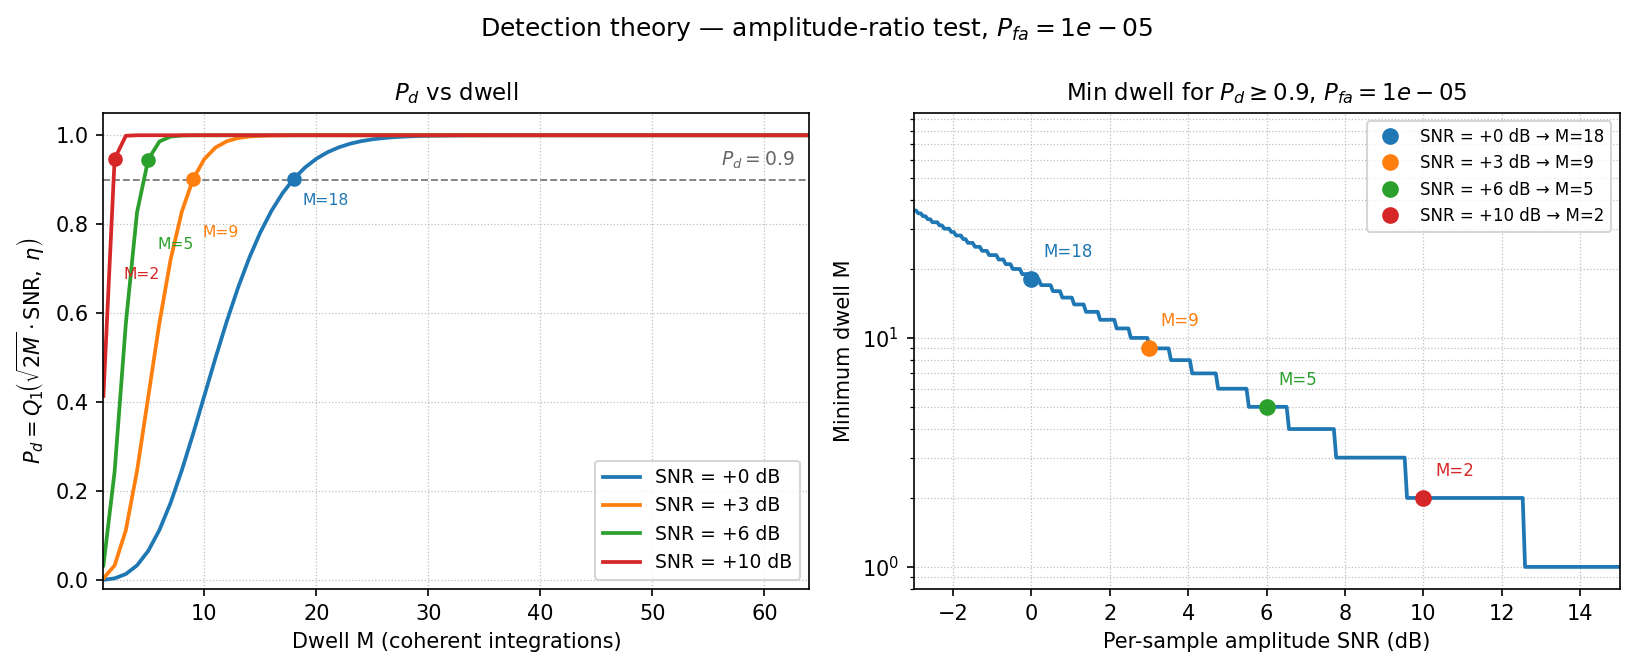
Left — Pd vs SNR for dwells M = 1, 2, 5, 9, 18 at Pfa = 1e-5. Curves shift left as M increases: more coherent integration trades dwell count for SNR sensitivity. Below ~−5 dB even M=18 struggles; above ~+8 dB a single dwell is already reliable.
Right — Pd vs dwell M at fixed Pfa = 1e-5, for SNR = 0, 3, 6, 10 dB. Every 3 dB of extra SNR roughly halves the required dwell. At 0 dB you need ~18 dwells for Pd = 0.9; at +6 dB you need only ~5.
How it works
det_pd, det_dwell, and det_threshold implement the closed-form
Marcum Q functions. No simulation is needed to set a threshold or
predict performance:
from doppler.detection import det_pd, det_dwell, det_threshold

PFA = 1e-5
eta = det_threshold(PFA)    # CFAR threshold from Pfa alone

# Pd at 0 dB SNR after M coherent integrations
for M in [2, 5, 9, 18]:
    snr_amp = 1.0            # 0 dB amplitude SNR
    pd = det_pd(snr_amp, M, eta)
    print(f"dwell={M:2d}  Pd={pd:.3f}")

# Minimum dwell to reach Pd ≥ 0.9 at each SNR
for snr_db in [0, 3, 6, 10]:
    snr_amp = 10 ** (snr_db / 20)
    M = det_dwell(snr_amp, 0.9, PFA, 64)
    print(f"SNR={snr_db:+d} dB  →  min dwell M={M}")
det_threshold inverts the Rayleigh CDF at Pfa to get the CFAR
gate eta. det_dwell binary-searches over M until
det_pd(snr, M, eta) >= pd_target.
See Detection Theory for
det_pd, det_dwell, and det_threshold in full detail, plus
Monte Carlo validation.