Four WCDMA Carriers — Welch, band_power, AccTrace
A multi-carrier monitoring scene: four WCDMA-like downlink carriers — QPSK at the 3.84 Mcps chip rate, one per 5 MHz channel — at deliberately different power levels (0, -3, -6, -10 dBFS), analysed end-to-end with the spectral-measurement suite. It answers the everyday spectrum-monitor question: is every carrier at the right power, and how clean is the channel?
What you're seeing
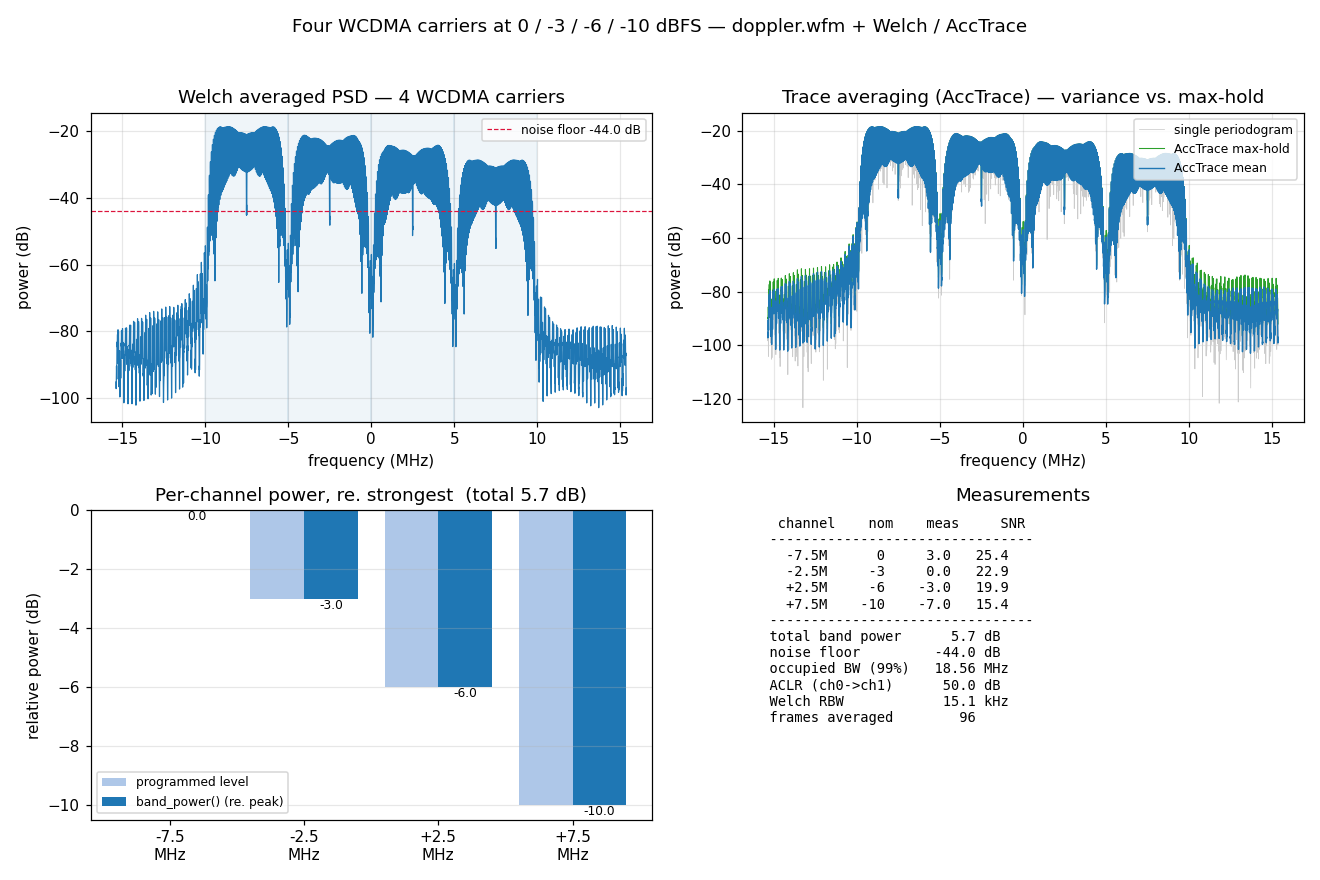
Top-left — the averaged PSD. Welch (Kaiser window, mean trace, 96 frames)
resolves four flat-topped ~5 MHz channels with the sharp root-raised-cosine
skirts of a real WCDMA signal. Each channel is shaded; the measured per-channel
power and the noise_floor() line are annotated.
Top-right — trace averaging with AccTrace. The same power frames folded
three ways: one raw periodogram (grey, ±10 dB of variance), the AccTrace mean
(the variance collapses), and the AccTrace max-hold envelope (green). Welch
is this pipeline — window → FFT → power → AccTrace — so the panel is a peek
under its hood.
Bottom-left — per-channel power. Welch.band_power(edges) recovers the
programmed 0 / -3 / -6 / -10 dB spacing exactly (shown relative to the strongest
carrier); total_band_power gives the whole occupied span.
Bottom-right — the measurements. Per-channel in-band SNR (snr), the global
occupied bandwidth (occupied_bw, 99 %), the noise floor, the adjacent-channel
leakage ratio (ACLR, the strongest carrier vs. the empty guard channel beside
it), and the Welch resolution bandwidth.
Building it
The carriers come from doppler's own waveform generator. WCDMA downlink is
noise-like QPSK with root-raised-cosine pulse shaping (β = 0.22, the WCDMA
roll-off), and the generator does exactly that — qpsk(pulse="rrc")
(doppler#115) band-limits
the chips in the C engine at unit transmit power, so each carrier is a single
generator call; freq= places it at the channel centre:
import numpy as np
from doppler.wfm import qpsk

FS, SPS = 30.72e6, 8                        # 8 samples / 3.84 Mcps chip

def rrc_carrier(fc, level, seed, n):
    sig = qpsk(sps=SPS, pulse="rrc", rrc_beta=0.22, rrc_span=8,
               freq=fc, fs=FS, seed=seed).steps(n).astype(np.complex64)
    return sig * 10.0 ** (level / 20.0)     # unit power -> level (dBFS)
Sum four of them at 5 MHz spacing over a composed AWGN floor, then measure with
Welch:
from doppler.spectral import Welch

w = Welch(n=4096, fs=FS, window="kaiser", beta=12.0, mode="mean")
w.accumulate(scene)                        # folds 96 frames into the average

edges = np.array([-10e6, -5e6, -5e6, 0, 0, 5e6, 5e6, 10e6])  # [lo,hi,...]
band_db = np.array(w.band_power(edges))    # per-channel power, dB
total_db = w.total_band_power(edges)
nf = w.noise_floor()
snr = w.snr(-10e6, -5e6)                   # in-channel SNR of carrier 0
Snapshot zero-copy results
psd_db() and band_power() return zero-copy views into Welch's
internal buffers (the library's variable-output idiom). Wrap a result in
np.array(...) if you need it to survive a later call to the same method —
e.g. the ACLR band_power(guard) call would otherwise overwrite an earlier
band_power(edges) view.
See also
- Welch / AccTrace API — the measurement methods.
- Accumulator API —
AccTracemodes. - Composing a Scene — the waveform generator.
examples/python/wcdma_carriers_demo.py— the script behind this figure.